Using Collaboration Tools
Learning Objectives
- Understand collaboration tools and their role in improving data quality.
- Effectively use completeness indicators, tags, and workflows to enrich and manage product sheets.
- Master specific use cases for collaborating efficiently and following defined processes.
Collaboration Tools and Data Quality
Collaboration tools, completeness indicators, tags, and workflows, are created and managed by the administrator of your PIM Quable.
The labels and rules of these indicators vary depending on the needs and solutions implemented by the administrator.
These collaborative tools assist you in enriching product sheets: consult them to ensure you are optimizing the data quality of the product sheets.
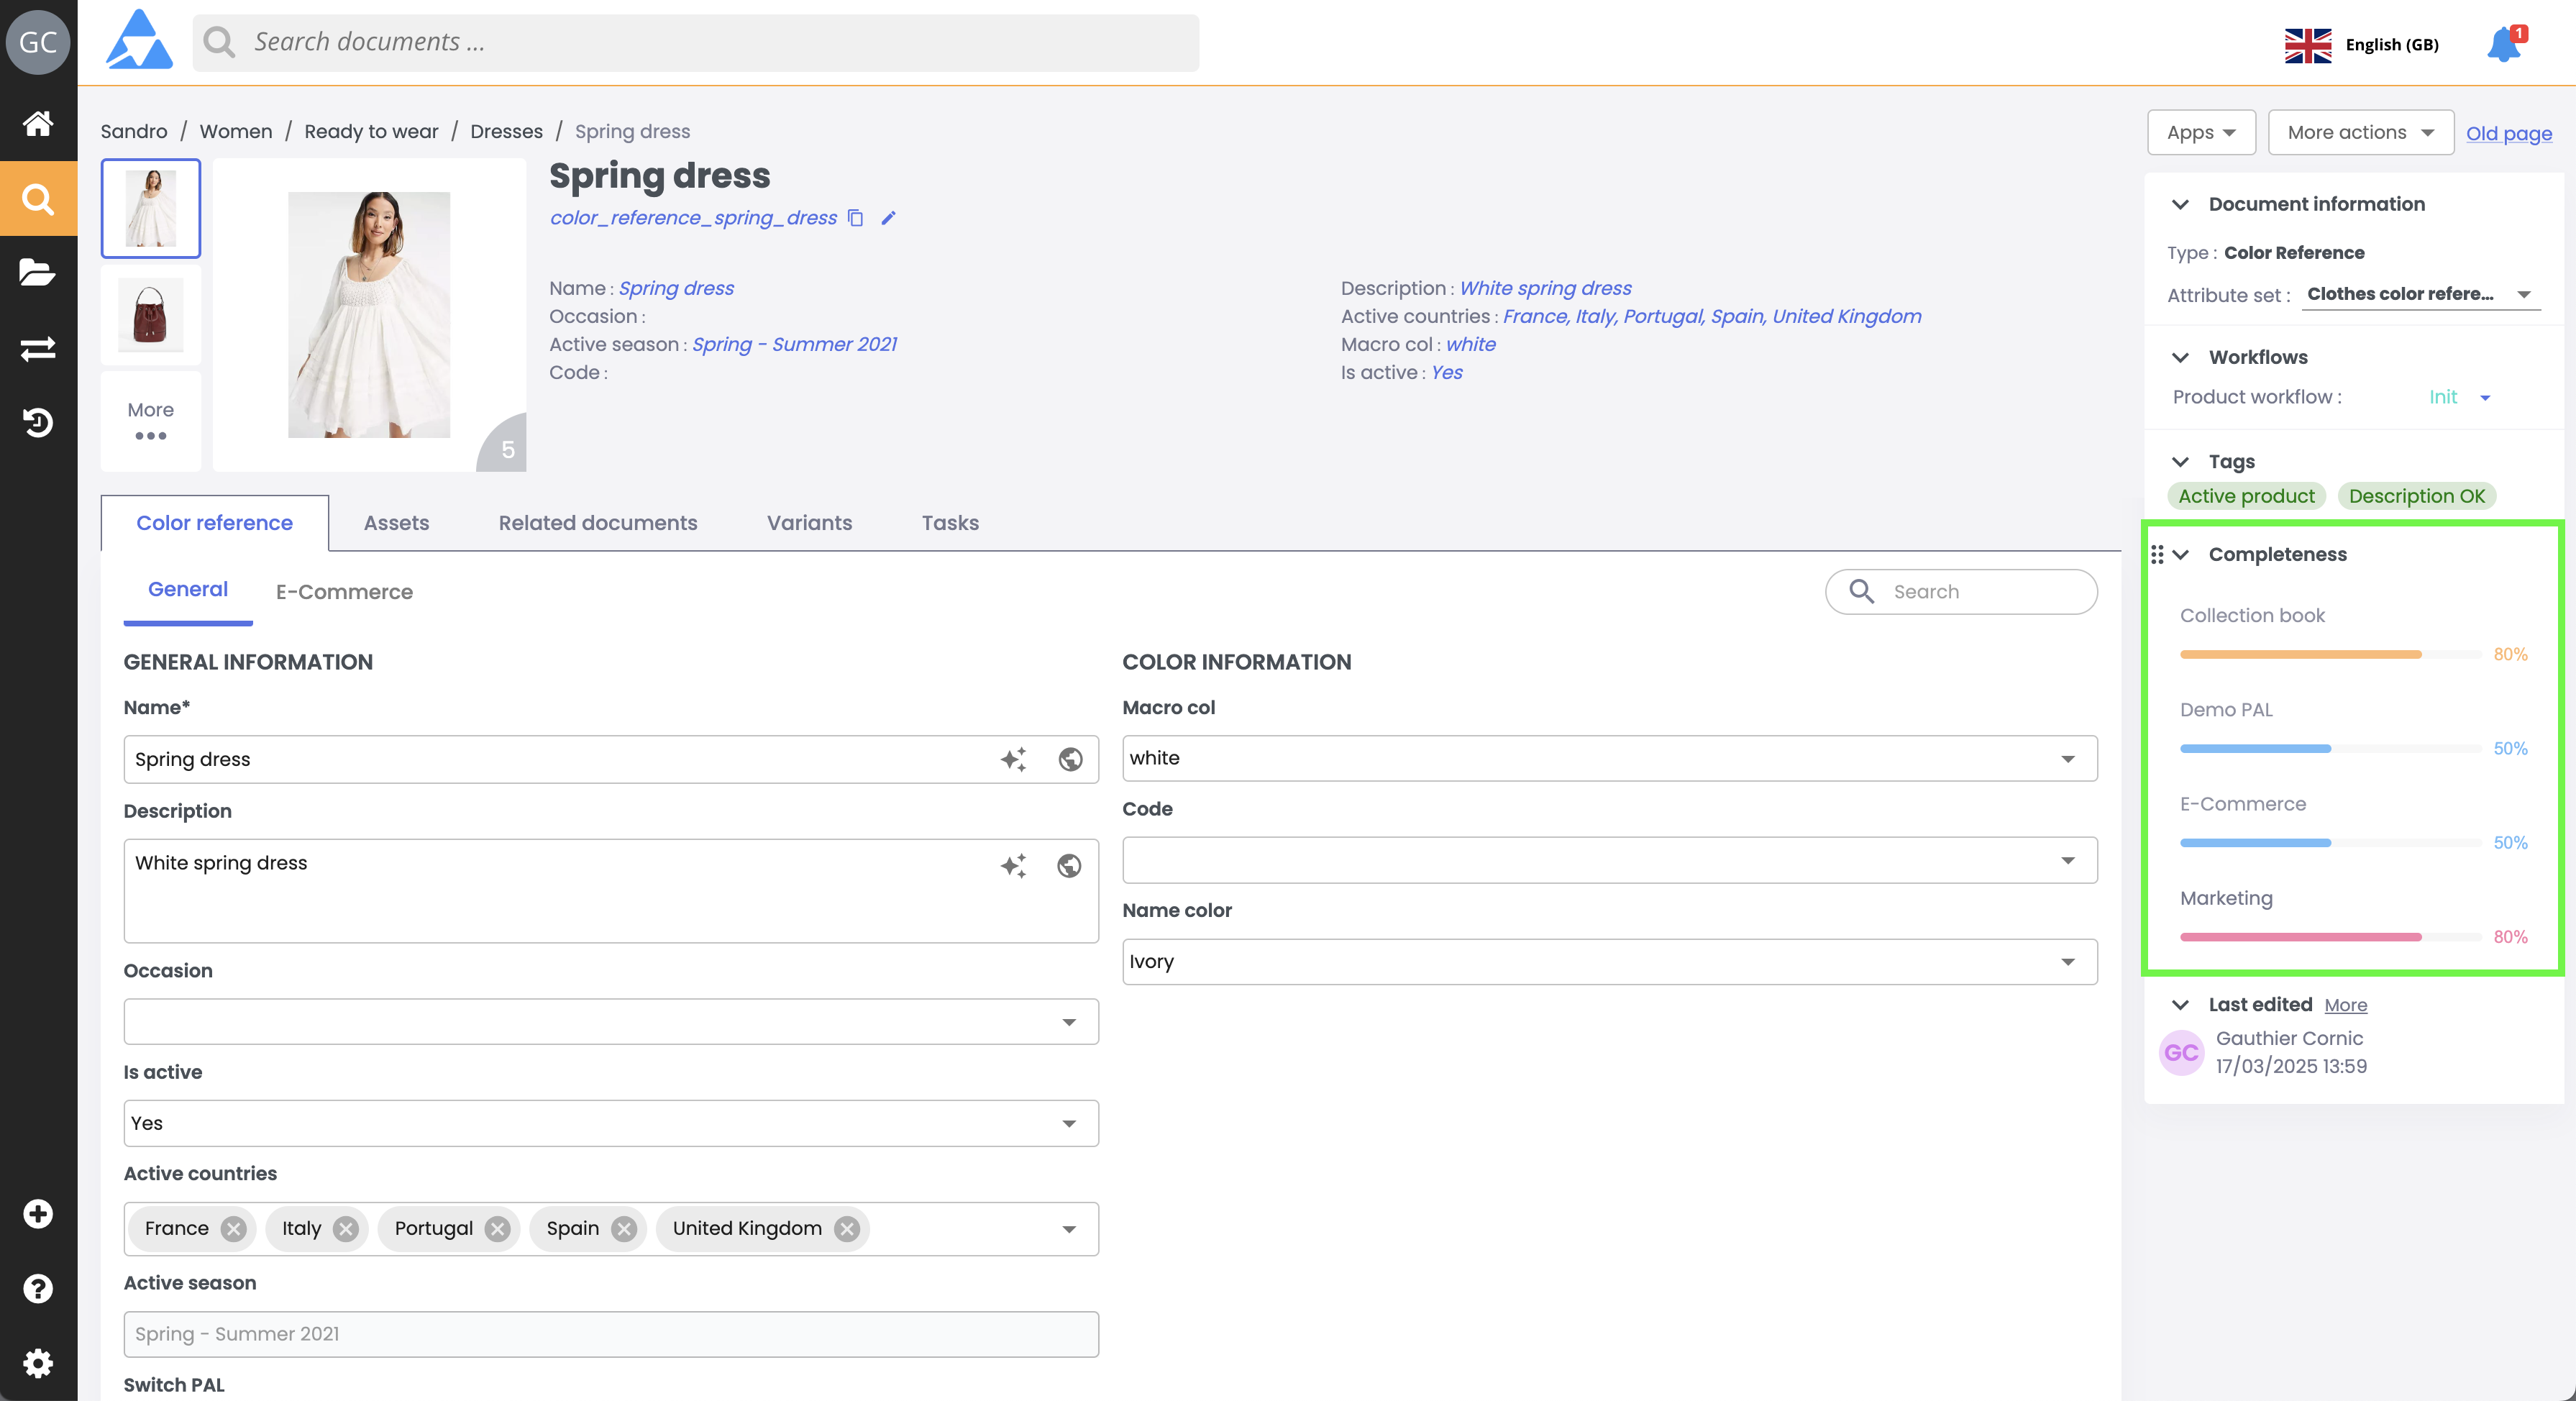
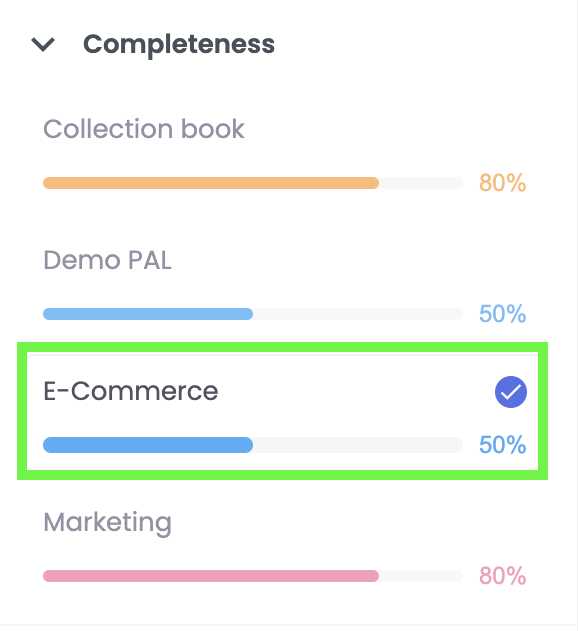
Completeness Indicators
Completeness indicators display the progress rates of product sheets and help visualize missing content. There can be multiple completeness indicators:
- According to the departments responsible for the data (e.g., marketing, legal, management control, logistics...),
- According to the destination of the data (e.g., website, extranet, marketplace…),
- Or a combination of both.
The completeness indicator allows you to track the progress of a product sheet's enrichment based on attributes and links to be completed.
- The more required elements are enriched with data, the higher the progress bar. Once all elements are completed, the indicator reaches 100%.
- Example with attributes: if an indicator relates to 20 attributes and 10 are enriched, the progress will be 50%.
- Example with Assets links: if the indicator relates to 3 links, each needing 3 assets:
- One link with 1 asset, another with 2 assets, and the last with 3 assets will only count as one complete link. Therefore, the progress will be 33%.
- A link is counted as complete only if it contains the exact number of required assets. Any incomplete link is not counted.
- Often, completeness indicators are combinations of attributes and links to enrich.
When you click on a completeness indicator:
- The attributes related to the indicator are displayed on the main screen, and all other attributes are hidden.
- A colored dot matching the completeness indicator will appear next to attributes that need to be enriched.
- A colored dot matching the completeness indicator will appear on content tabs containing attributes or links that need enrichment.
- On content tabs, the number displayed corresponds to the number of elements that need to be enriched.
Click again on a completeness indicator to deselect it. All the attributes of the product sheet will be displayed again.
Identify which completeness indicators are relevant based on your business needs, and follow them to guide you in enriching the data on the product sheet.
Use Case:
Imagine you are responsible for enriching E-commerce data on product sheets. You need to go to a product sheet and identify the completeness indicator corresponding to your business scope.
How does this work? Follow the guide:
-
Completeness indicators are located in the right panel of the product sheet,
-
Click on the "E-Commerce" completeness indicator in blue to display the relevant attributes and hide those that are not relevant,
-
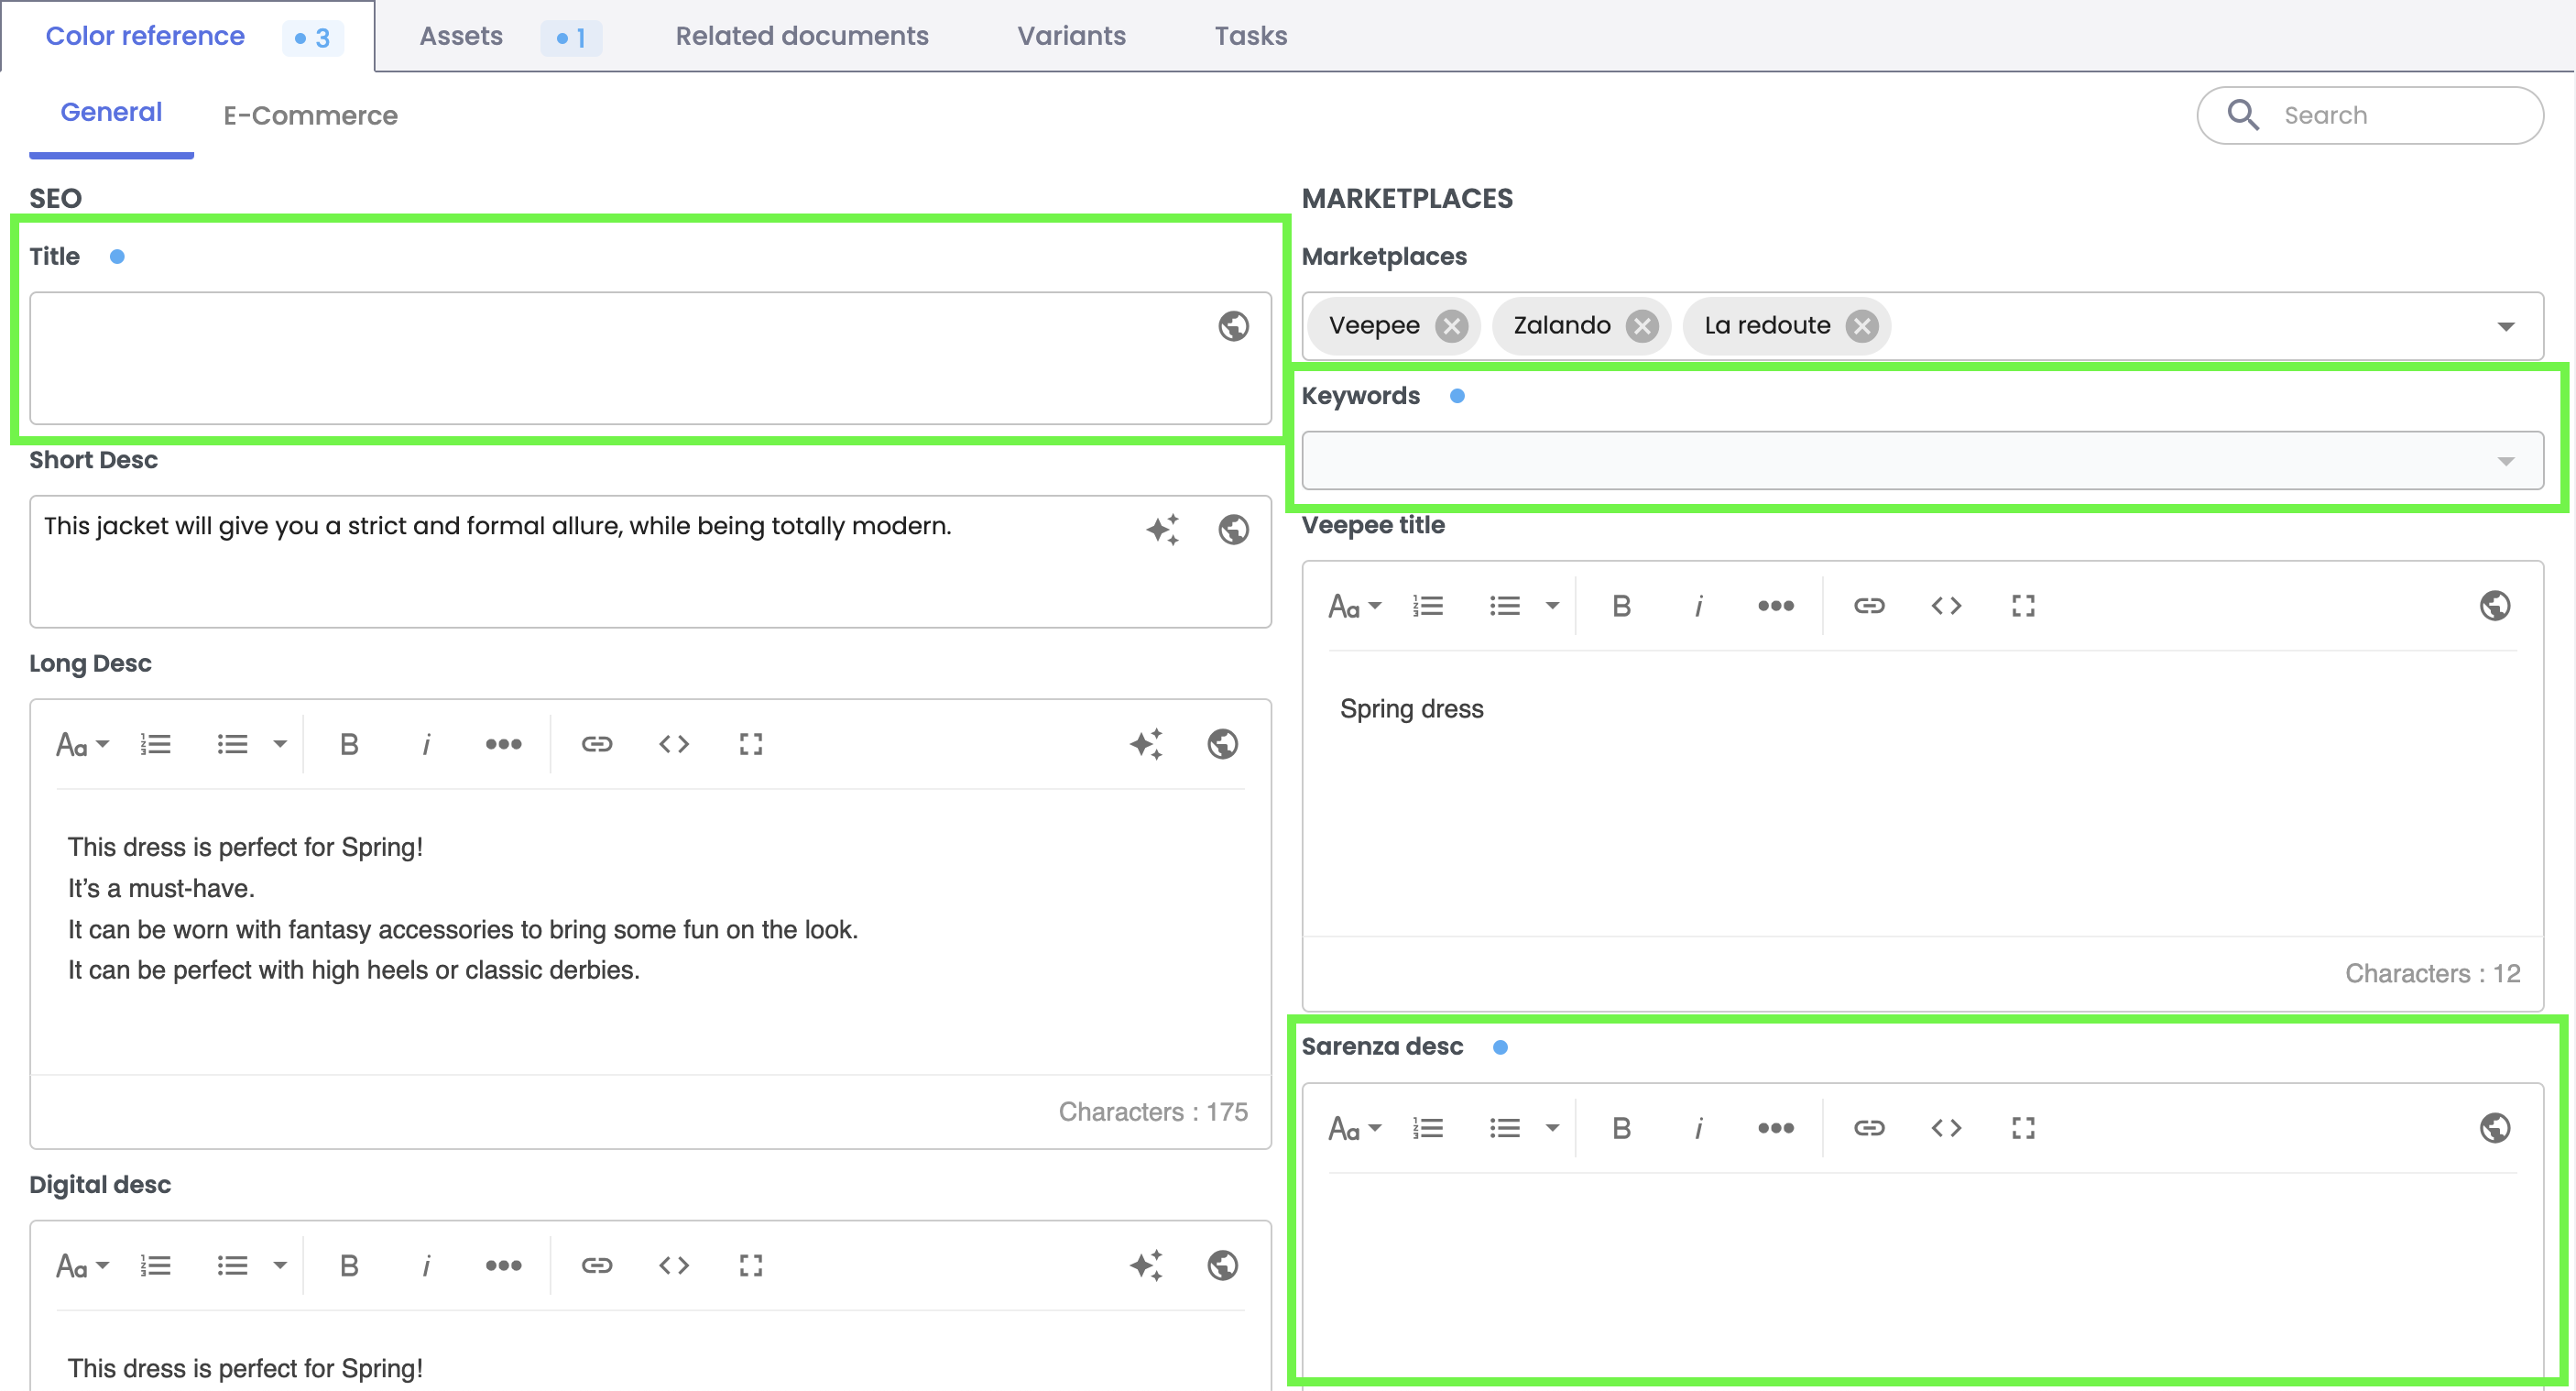
The colored dots, blue in this example, on the content tabs indicate that attributes or links need to be enriched.
- The "3" on the "Color reference" tab indicates that one attribute is waiting to be enriched on this tab.

- The "1" on the "Assets tab" indicates that one asset are waiting to be enriched on this tab. Click the dropdown menu to select which links need to be enriched and with how many assets. In this example, the "Top view" link needs to be enriched with 1 more asset.

-
The colored dots next to attributes indicate that data needs to be enriched on these attributes. In this example, it is the **"Title"**and the following attributes that need to be enriched.
-
Fill in the data wherever it is required, on the attributes and links, and save: the completeness indicator’s rate progresses. Once all the data is filled in and you have saved all your contributions, the progress bar will reach 100%.
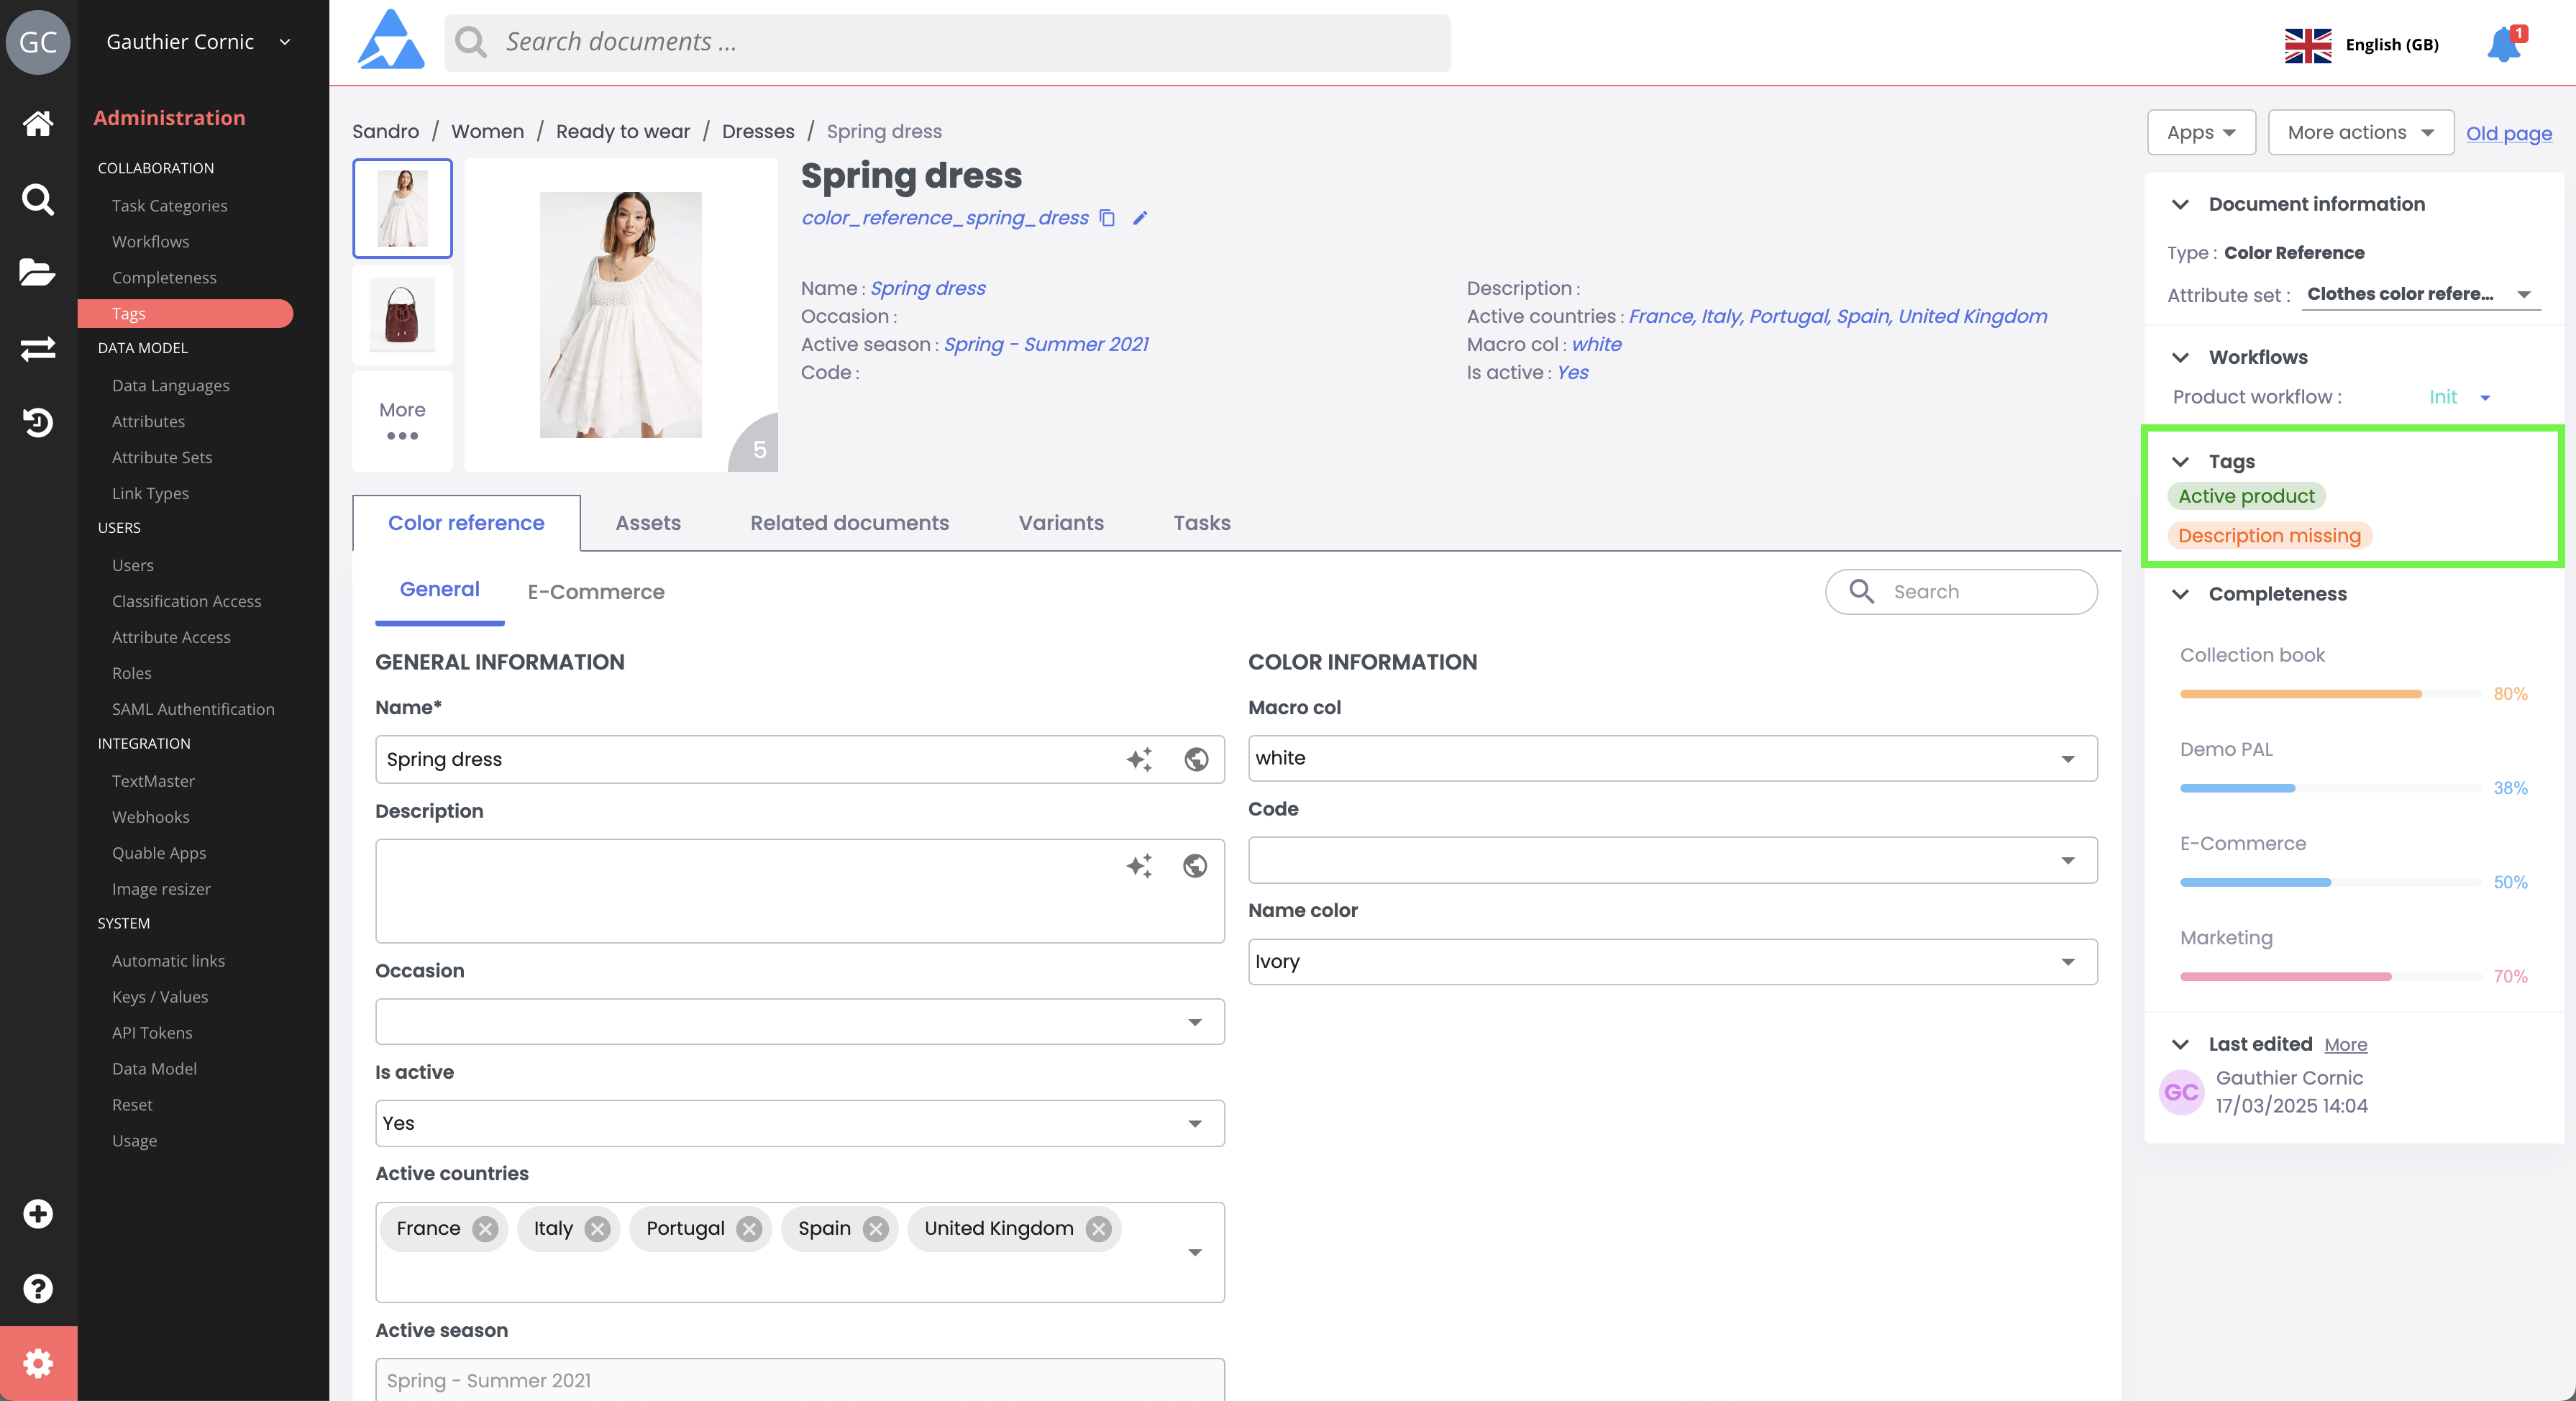
Tags
Tags display the stages or statuses of product sheets and help visualize what actions need to be taken next.
Tags display messages in colored tooltips. They rely on rules defined by the administrator. If the rule is fulfilled, the tag is displayed. If not, the tag is not displayed.
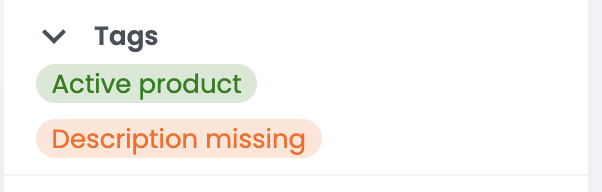
For example, if a tag rule is defined:
- IF the Description attribute is empty
- Then the tag displays the message: "Description Missing"
and
- IF the Description attribute is enriched
- Then the tag displays the message: "Description OK"
Tags are not interactive; however, when you hover over them, the full message of the tag will be displayed in a tooltip.
A best practice is to use tags to highlight important information or required actions on the product sheet, for example:
- Important attributes are missing,
- Important asset are missing,
- The product sheet is ready to be published…
Use Case:
-
Tags are located in the right panel of the product sheet,
-
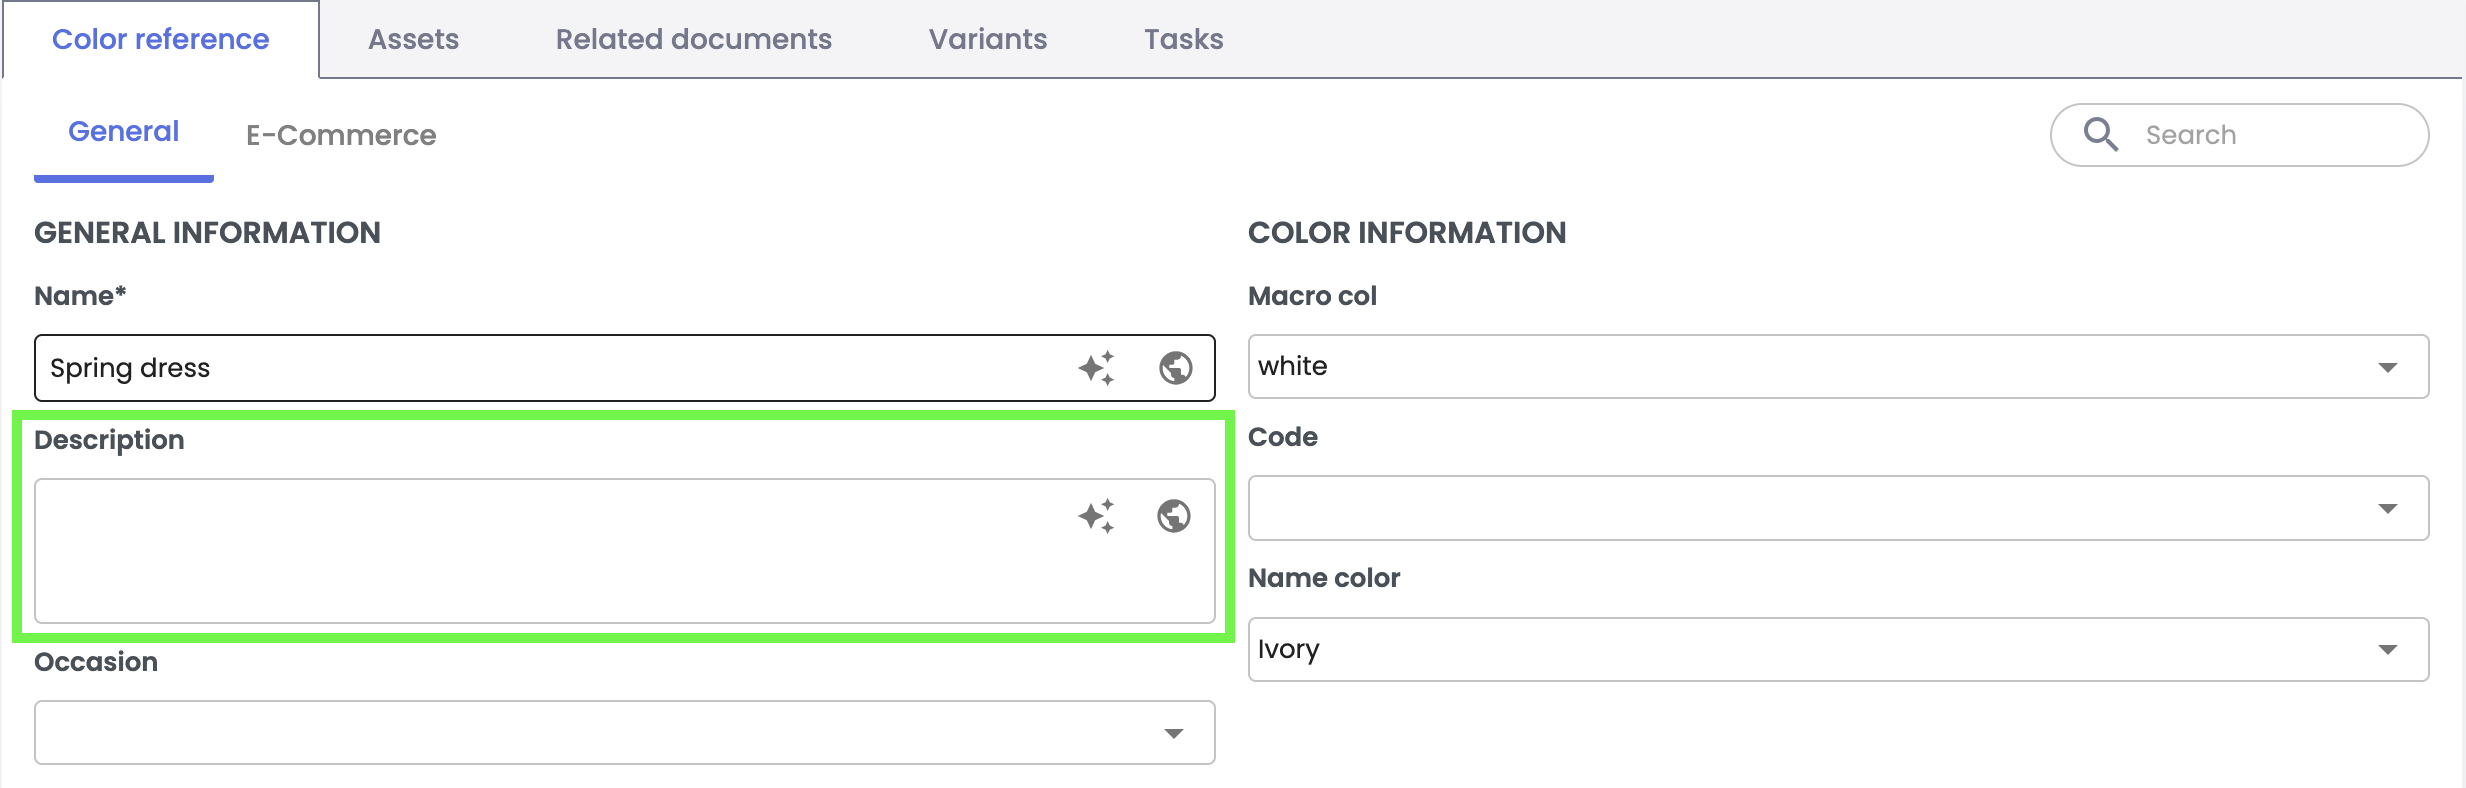
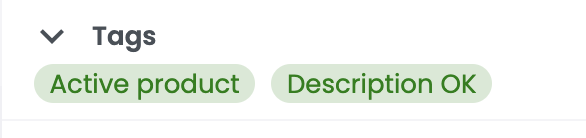
Read and identify the tags for which you can contribute and take action on the product sheet. To continue the previous example, the "Description Missing" tag indicates an important action to take.
-
Enrich the data on the "Description" attribute and hit the save button to save your contribution.
-
The "Description Missing" tag is no longer displayed.
Workflow
A workflow is a series of successive steps that ensures product sheets follow a specific process from start to finish. For example, a workflow may follow the following sequence of steps:
- contribution → validation → distribution
- marketing → e-commerce → translation → distribution
These steps follow a sequence of operations and validation steps for specific tasks among the various contributors on the product sheets.
The use of a workflow is not automatic: transitioning from one step of the workflow to the next requires a manual action from the user.
The ability to interact with a workflow step depends on the user's role. For example, only users with the contributor role will be able to move the workflow from the contribution step to the next.
Use Case:
Let's imagine you are responsible for enriching data on product sheets and have a contributor role. You need to go to a product sheet, then:
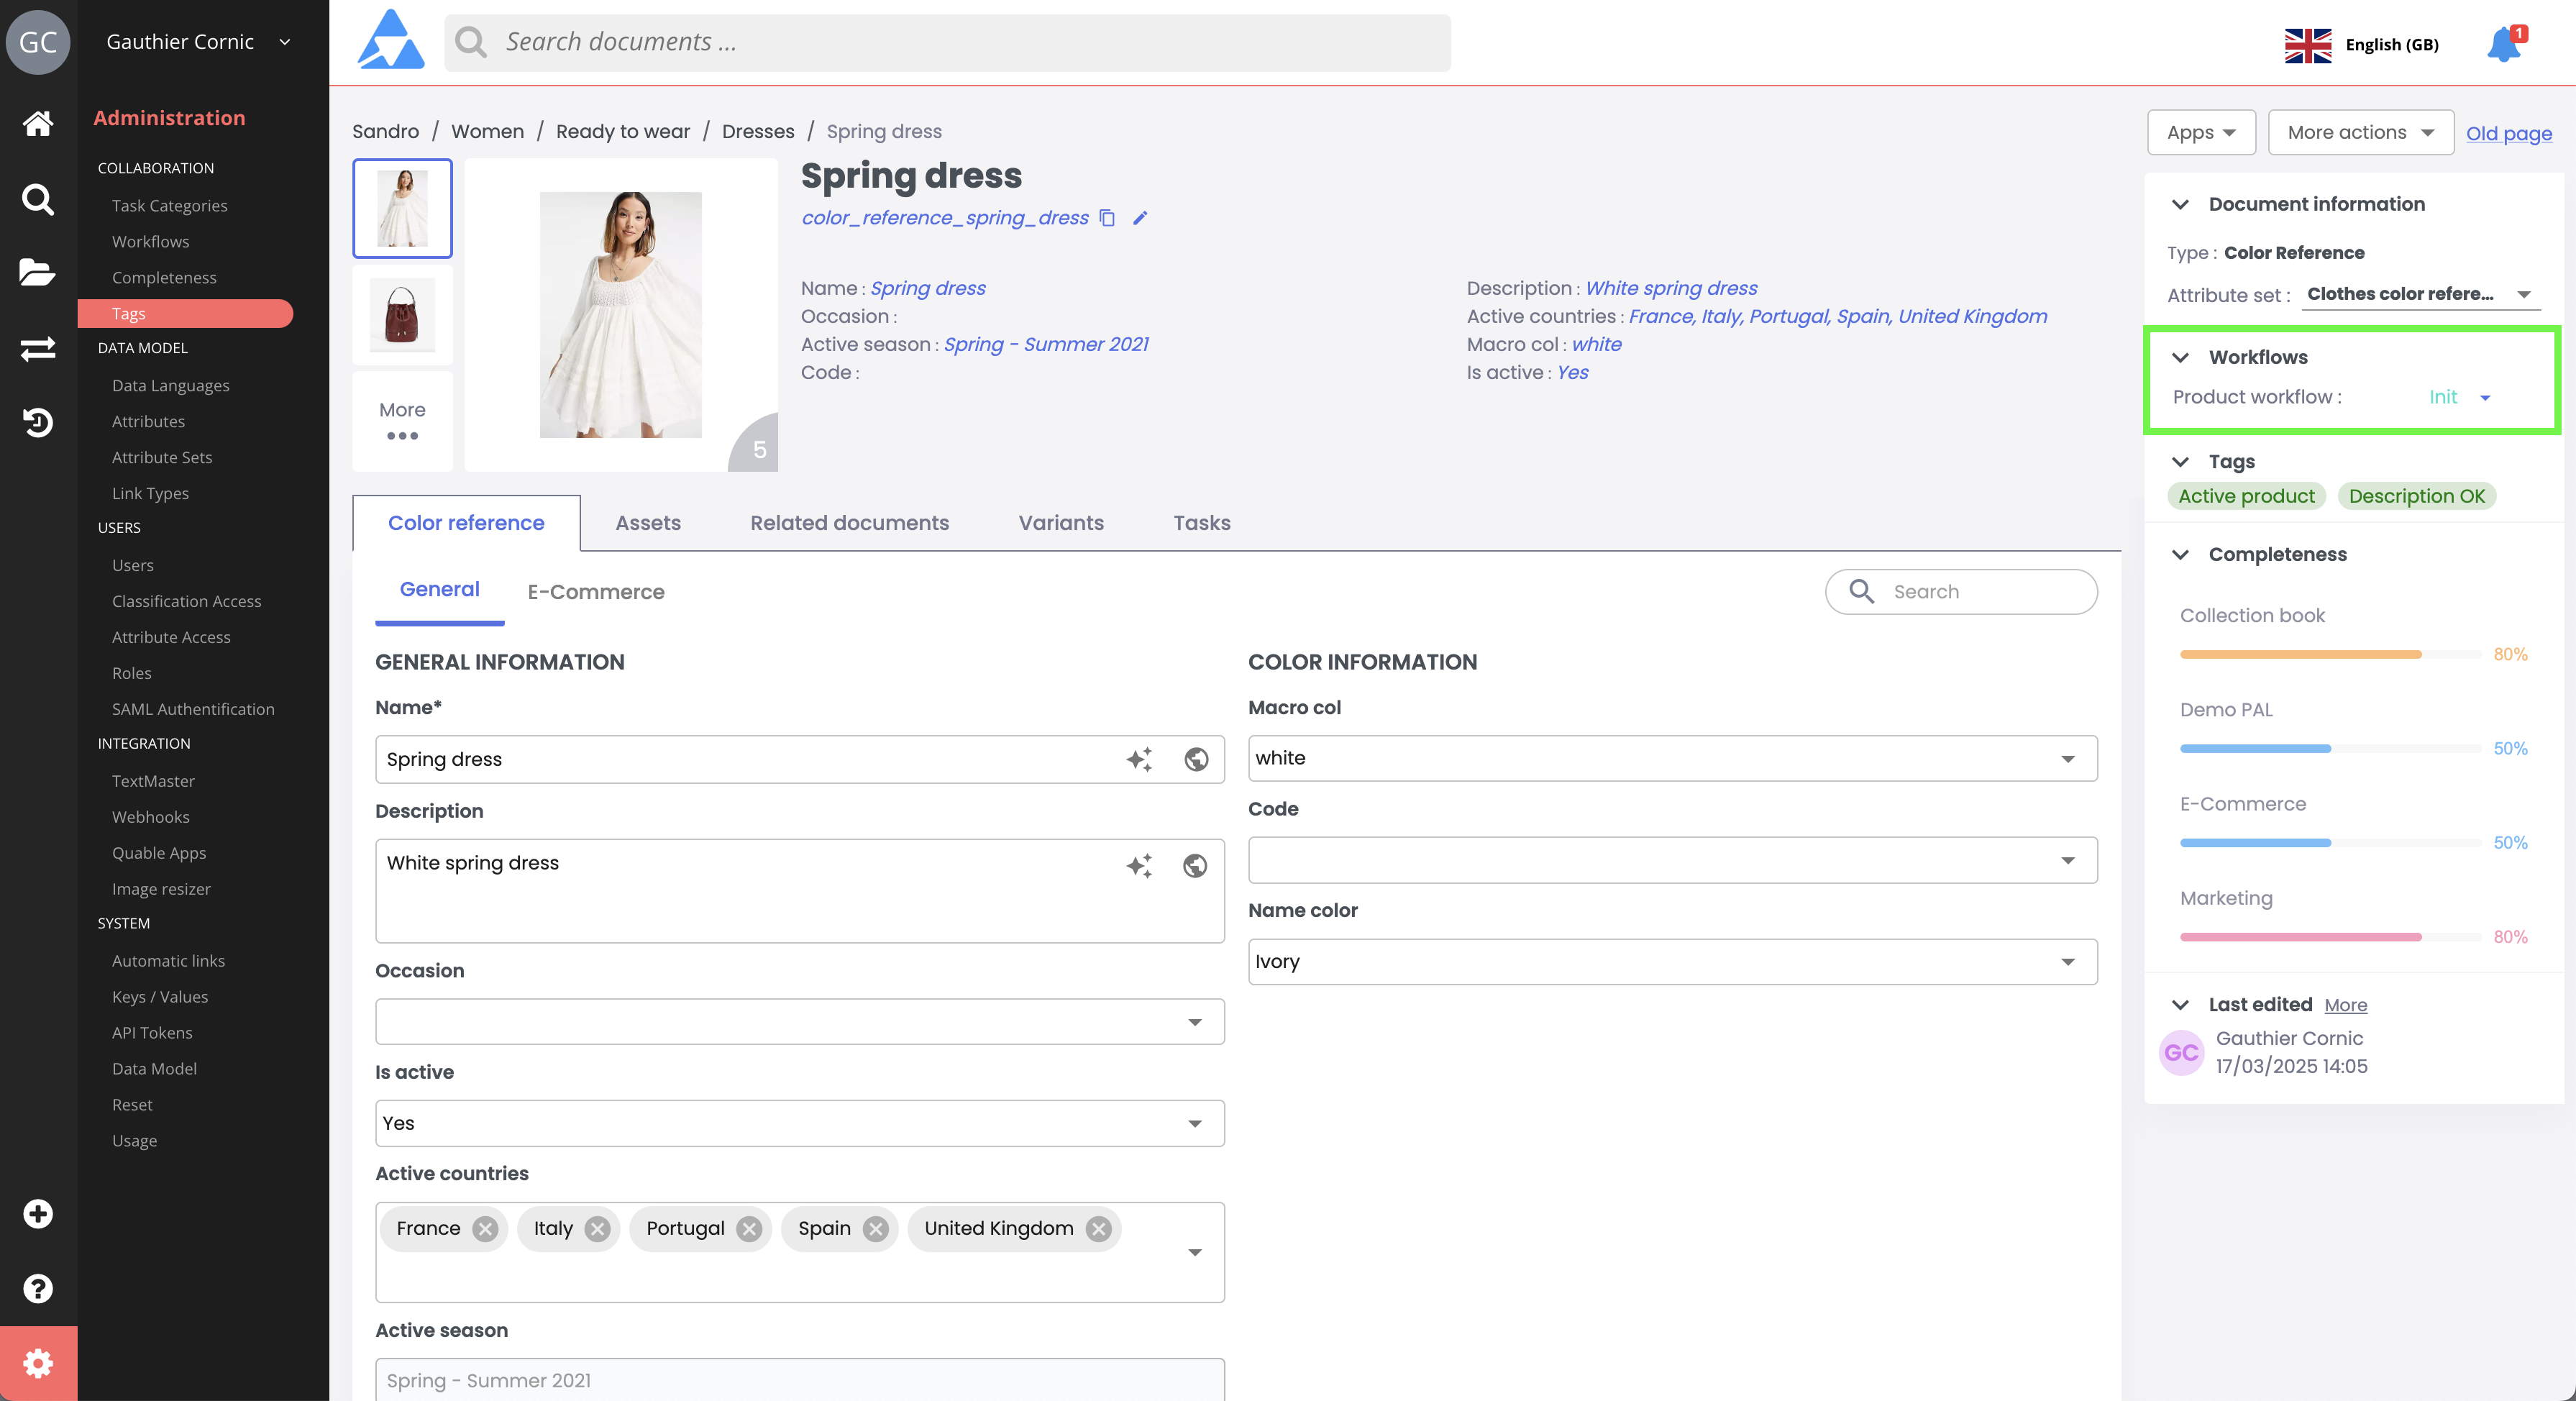
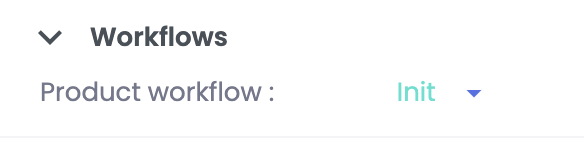
- Identify in the right panel of the product sheet the label of the workflow to know which step of the workflow the product sheet is in,
-
In our example, the workflow step is “Contribution”, which corresponds to your job scope,
-
Enrich the data on the attributes and relationships that pertain to you as a contributor,
-
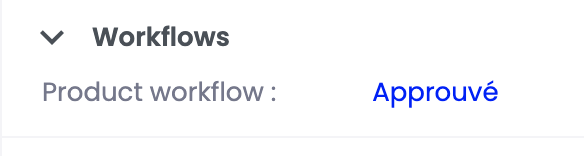
Once your contribution is complete and saved, the product sheet is ready to move to the next step in the workflow,
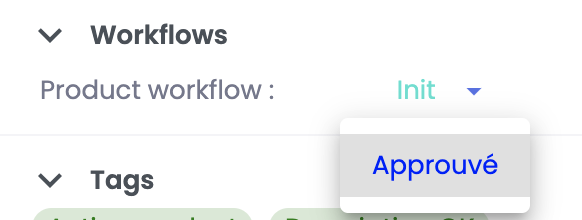
-
Click on the workflow and select a step to move the product sheet to the next sequence.
Important Note
- Once the workflow has been moved to a step, it is not possible to revert to the previous step.
- If you are unable to move to the next step, ensure you have the required permissions to interact with the workflow.
In summaryCompleteness, tags, and workflows are collaborative tools. They are created by the PIM Quable administrator and help ensure data quality.
- Completeness Indicators: They measure the progress of product sheet enrichment based on attributes and relationships to complete.
- Complete items advance the indicator.
- A relationship is considered complete when all required data is filled.
- Tags: They indicate important states or actions to be taken on the product sheet through predefined rules.
- Workflows: Manual sequences to validate process steps and move to the next.
- Access rights and roles determine the actions possible on each step of the workflow.
Next Chapter
Now that you know how to use collaboration tools, let's explore how to Create a Widget on the Dashboard.
Updated 10 months ago