Widgets
Enhanced visibility of your PIM content!
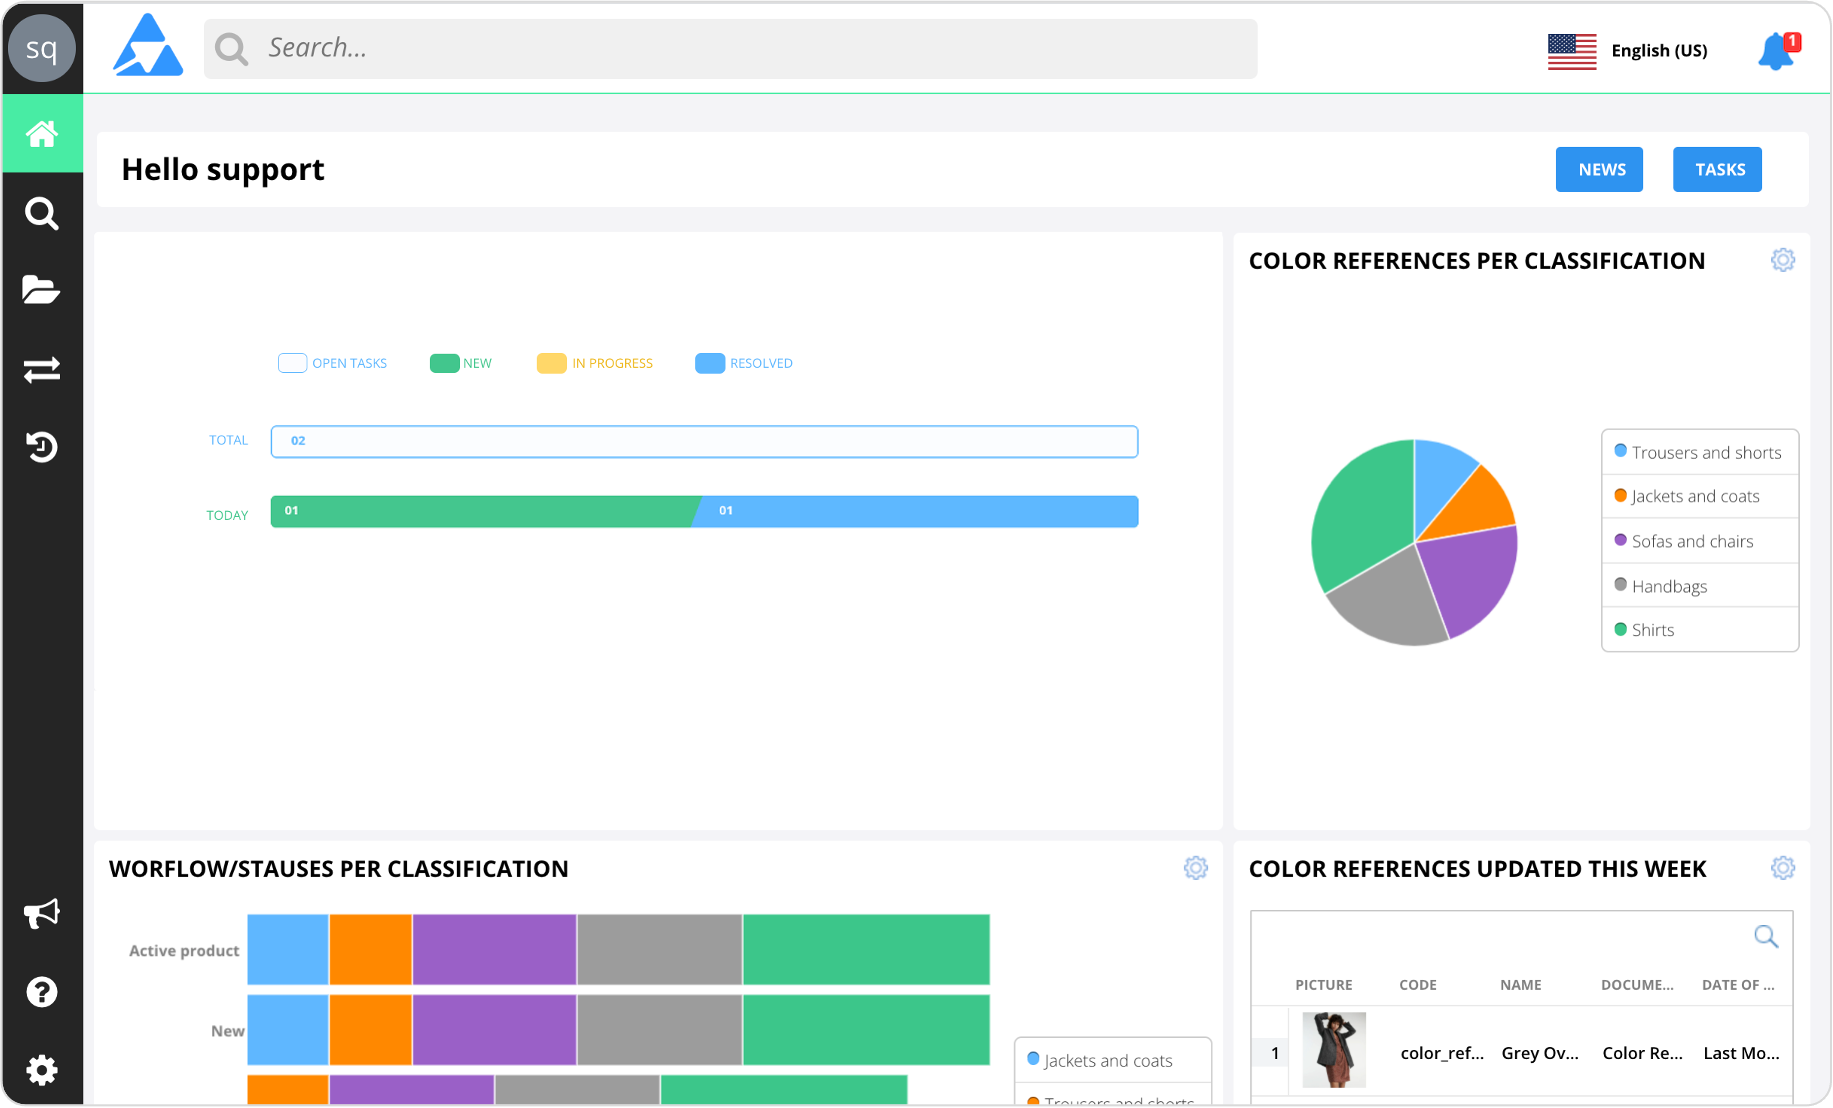
Quable PIM widgets bring your dashboard to life by presenting your data graphically to help you easily see and understand it. They help you improve time management, and strengthen collaboration and efficiency.
Actions You Can Perform
Creating Widgets
Widgets are created differently according to their type:
Organizing Widgets
Widgets are displayed on the dashboard in two columns. You can change a widget's location by clicking on its title and dragging and dropping it into another location designated by a dotted blue frame.
There's no limit on the number of widgets you can have on your dashboard, however we highly recommend no more than 20 to ensure their dynamic nature doesn't negatively impact your PIM's performance.
Removing Widgets
You can remove a widget from your dashboard by clicking on the gear in the upper right corner of a widget and selecting Remove. The Deleting A Widget dialog is displayed. Click on the Yes button to remove the widget or the No button to abort the deletion.

Editing Widgets
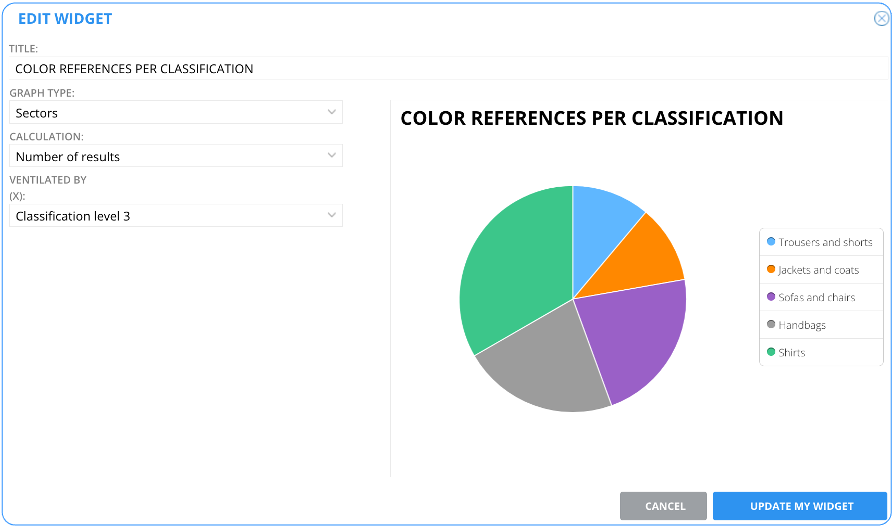
You can edit a widget by clicking on the gear in the upper right corner of a widget and selecting Edit. The Edit Widget dialog is displayed. Edit the widget and click the Update My Widget button to save your changes or the X in the upper right corner to exit the dialog without changing the widget.
Duplicating Widgets
You can copy a widget by clicking on the gear in the upper right corner of a widget and selecting Duplicate. The widget is immediately duplicated and added to the bottom of your dashboard.
Sharing Widgets
(Administrators only)
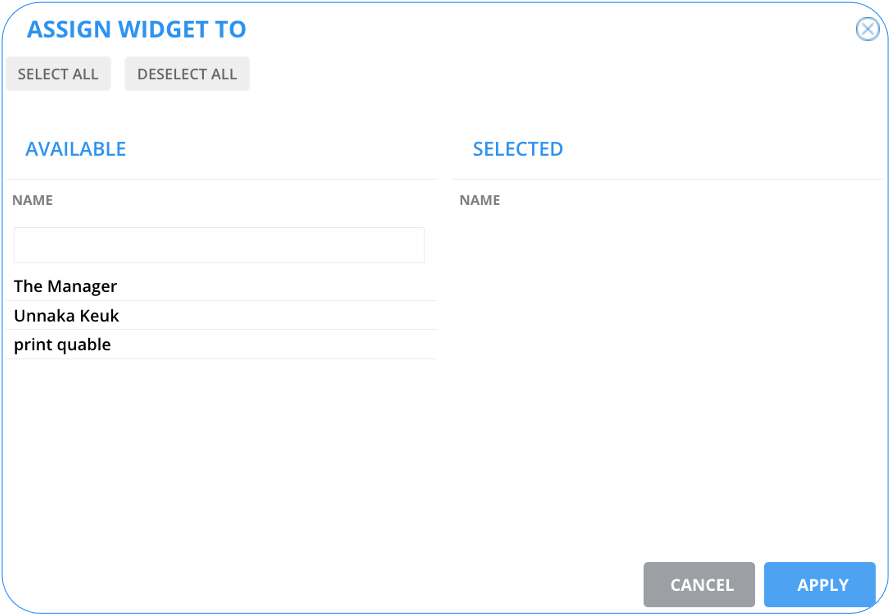
You can share a widget from your dashboard with other users. Select a widget, click on the gear in the upper right corner and select Attribute. The Assign Widget dialog is displayed.
You can:
- enter a name in Name to search for a specific user or
- select users by dragging and dropping them from the left panel to the right panel
You can also use the Select All or Deselect All buttons to move users between panels.
Click on the Apply button to validate the widget assignment or Cancel to abort the operation.
Widget Types
Task Tracker
This widget displays the number of tasks assigned to you and their status. It is automatically displayed on your dashboard and filled when tasks are assigned to you. If you have no open tasks, the widget displays "No tasks". Clicking on the widget opens the Tasks page.
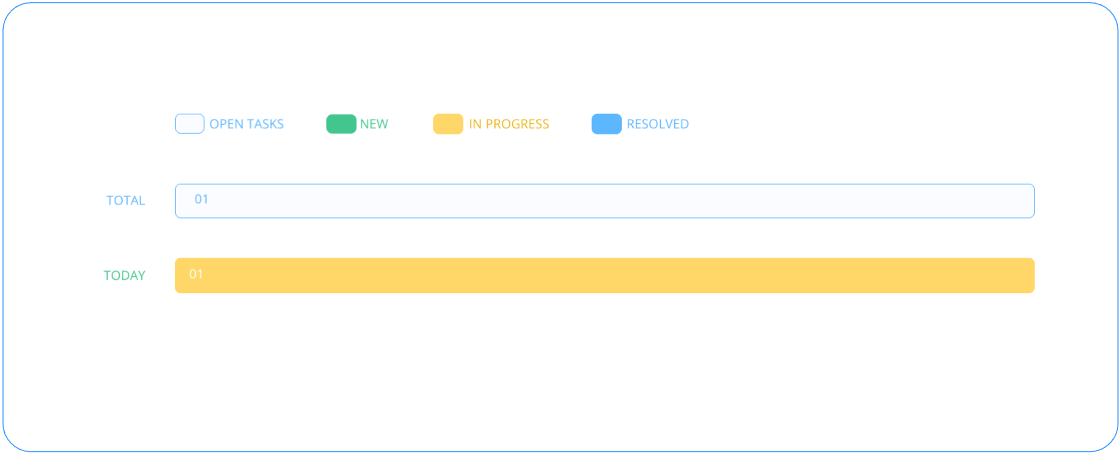
Closed tasks are not included in the widget.
Saved Search List
You can save searches as a list on your dashboard. This can be particularly useful for following the evolution of workflows or the status of certain types of documents.
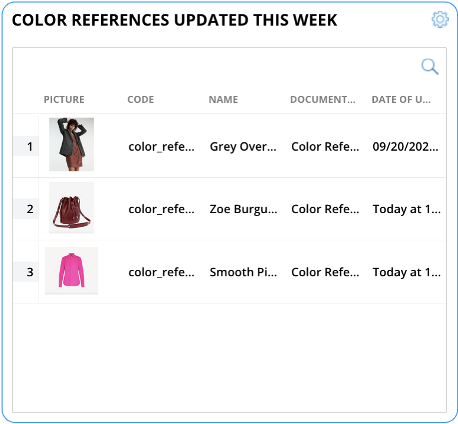
To create this widget, run a search on the Advanced Search page. Click on the Save this Search button to open the following dialog:
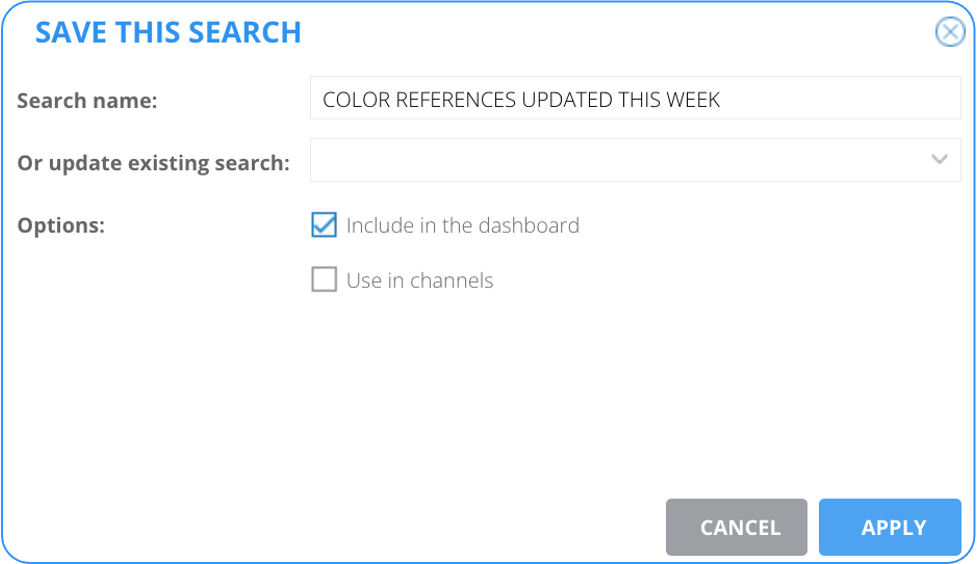
Complete one of the following:
- Search name - Enter a name to save a new search
- Or Update existing search - Select an existing search to replace/update
You can also select one or both of the following Options:
- Include in the dashboard- Adds the search as a widget on the dashboard
- Use in channels - Makes the search available to feed distribution channels
Charts
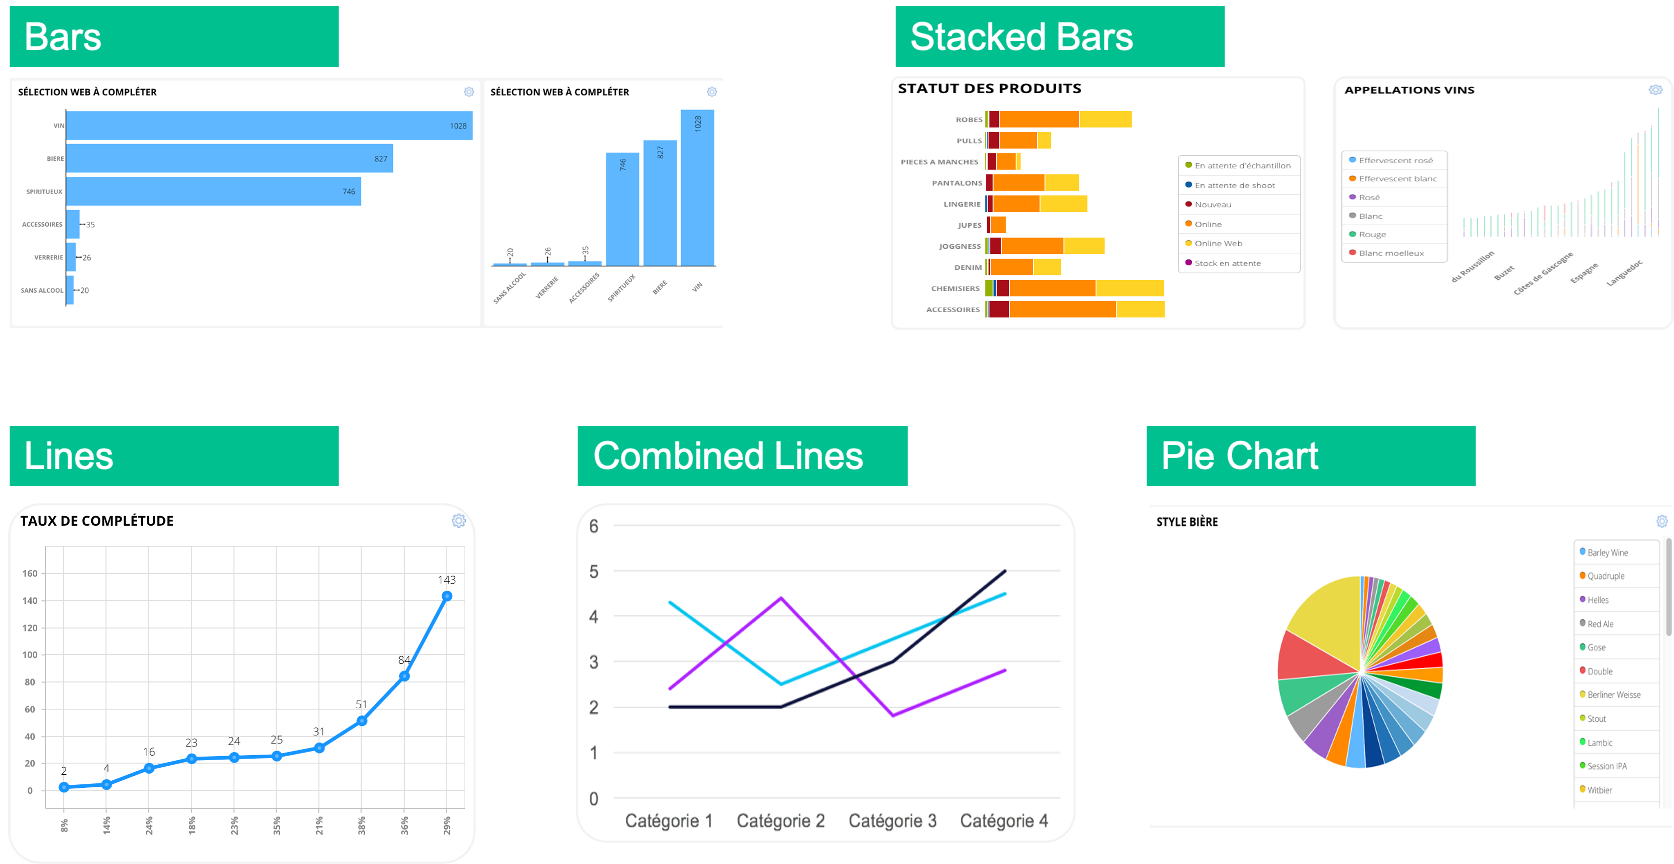
Charts are based on a selection of your PIM objects (documents, assets, classifications, or variants) to display a variety of information.
The following types of charts are available:
Creating Charts
To create a new chart widget, run and save a search on the Advanced Search page. This is very similar to a Saved Search List, however do not select the Include in the dashboard option. Instead, after saving the search, click on the Widgets button.
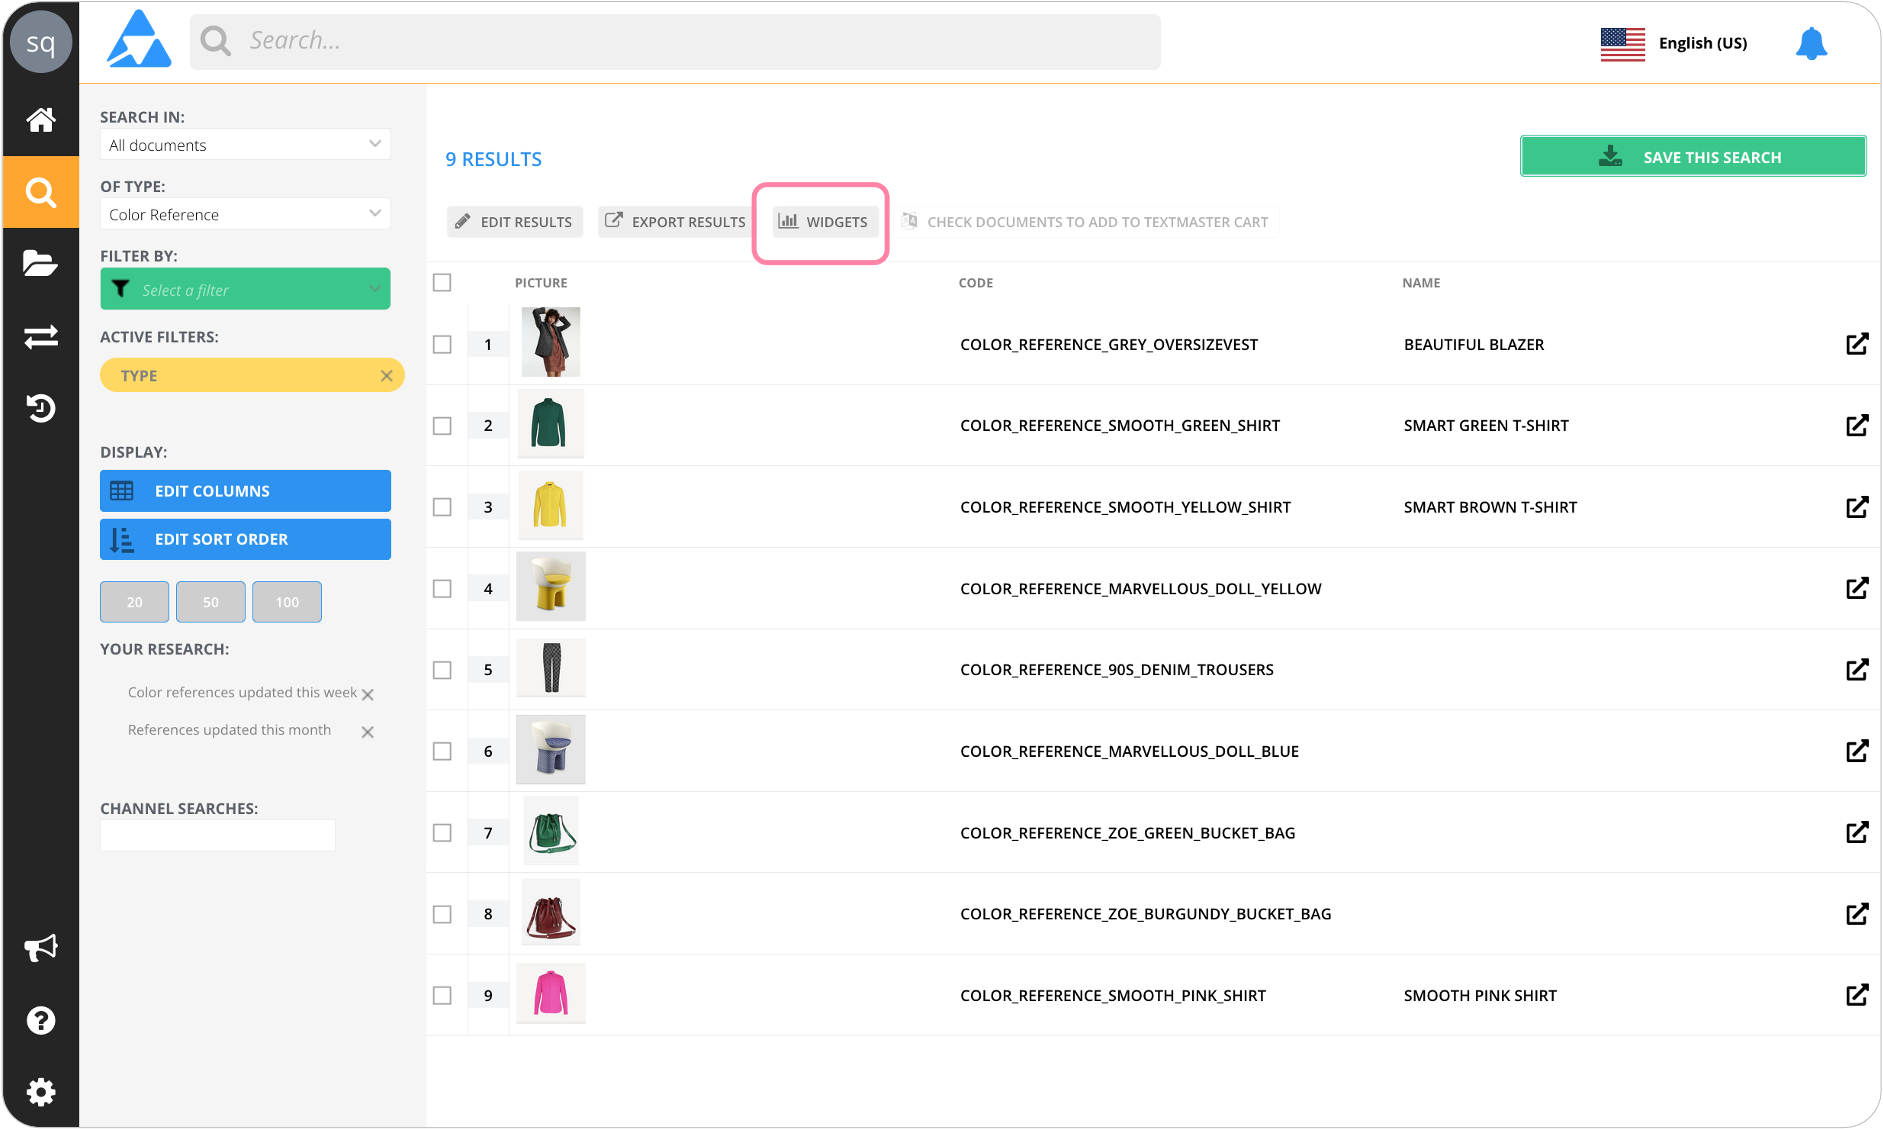
This opens the New Widget dialog.
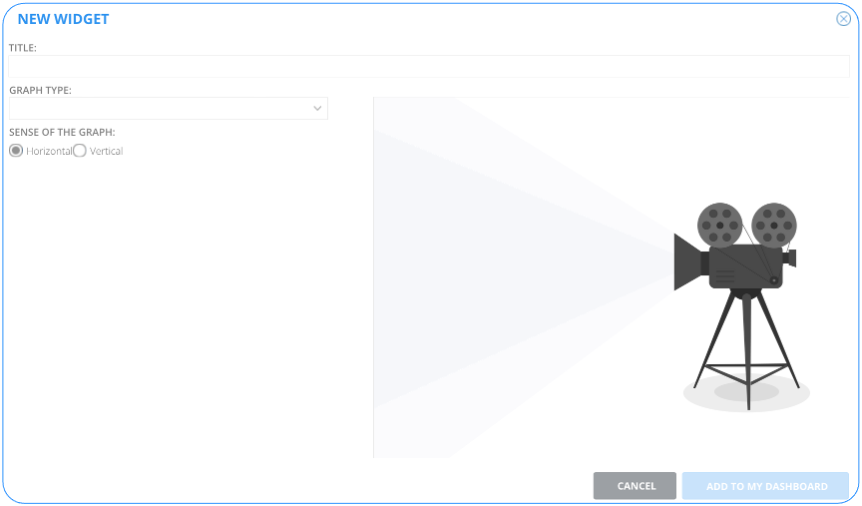
The required information depends on the type of chart you want to create.
Required Information | Description | Chart Type |
|---|---|---|
Title | Enter a name for the widget | All charts |
Graph Type | Select a type of chart | All charts |
Sense of the graph | Specify a direction for the bars: Horizontal or Vertical | Bars Stacked Bars |
Calculation | Select the data the chart will measure:
| Bars Stacked Bars Lines Combined Lines Pie Chart |
Data (Y) | Data for the vertical measurements. Can be a:
| Bars Stacked Bars Lines Combined Lines Pie Chart |
Data Breakdown By (X) | Select data for the horizontal measurements. Can be a:
| Bars Stacked Bars Lines Combined Lines Pie Chart |
And Data Breakdown By (X) | Select data for a second set of horizontal measurements. Can be a:
| Stacked Bars Combined Lines |
When you've finished selecting the data points for your chart, click the Add to My Dashboard button. Your new widget is automatically added to the bottom of your dashboard.
Example Charts
The following sections describe the steps to create chart widgets based on specific scenarios.
Based on Workflow
To create a horizontal stacked bar chart widget based on the steps or statuses of a workflow like this:
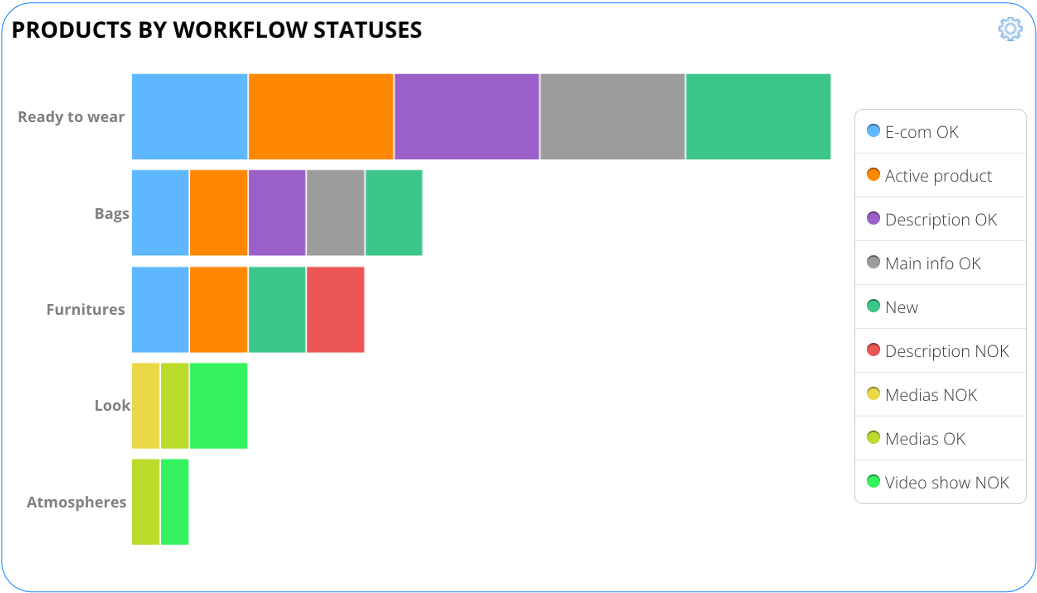
- Run and save a search on the Advanced Search page.
- Click on the Widgets button to open the New Widget dialog.
- Name - Enter a name for the widget
- Graph Type - Select Stacked Bars
- Sense of the graph - Select Horizontal
- Calculation - Select Number of results
- Breakdown By (X) - Select Workflow
- And Data Breakdown By (X) - Select a different data point (Classification, Completeness, or Filterable attribute)
- Click the Add to My Dashboard button. Your new widget is automatically added to the bottom of your dashboard.
Based on Completeness
To create a pie chart widget based on the completeness level of a document type like this:
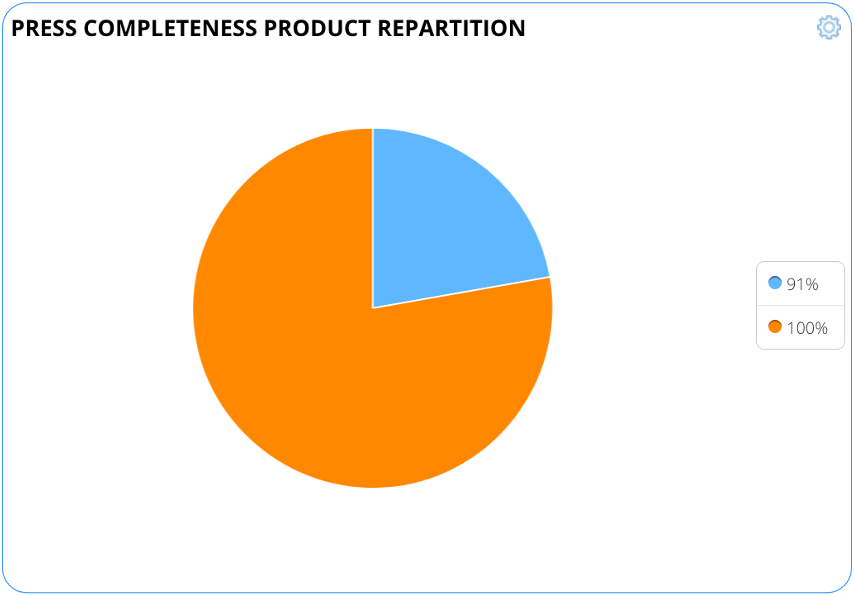
- Run and save a search for a specific document type on the Advanced Search page.
- Click on the Widgets button to open the New Widget dialog.
- Name - Enter a name for the widget
- Graph Type - Select Sectors
- Calculation - Select Number of results
- Breakdown By (X) - Select the Completeness Rate (in %) or Status (Complete / Incomplete) you want to display
- Click the Add to My Dashboard button. Your new widget is automatically added to the bottom of your dashboard.
Based on classification
To create a horizontal bar chart widget based on the classification of your data like this:
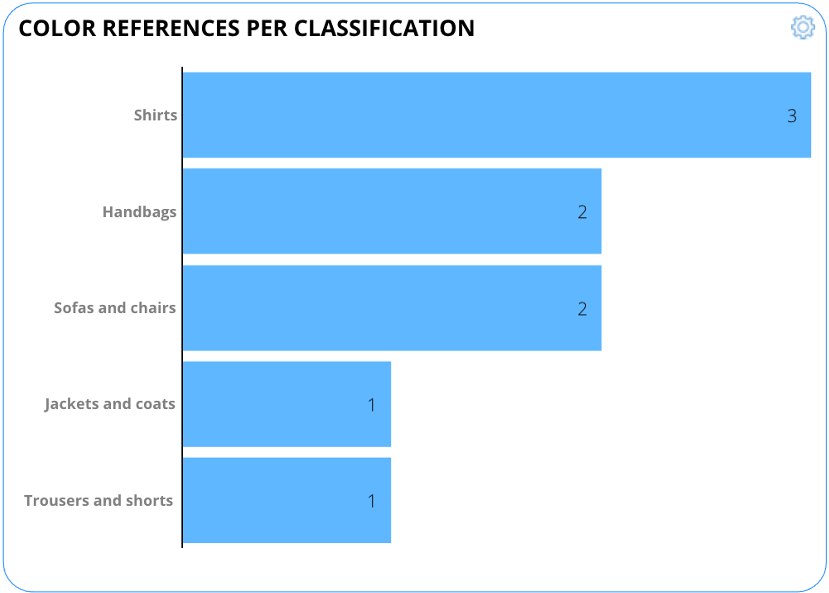
- Run and save a search on the Advanced Search page.
- Click on the Widgets button to open the New Widget dialog.
- Name - Enter a name for the widget
- Graph Type - Select Bars
- Sense of the graph - Select Horizontal
- Calculation - Select Number of results
- Breakdown By (X) - Select Classification level 3
- Click the Add to My Dashboard button. Your new widget is automatically added to the bottom of your dashboard.
Based on List Attribute
To create a horizontal bar chart widget based on a single or multiple selection list attribute like this:
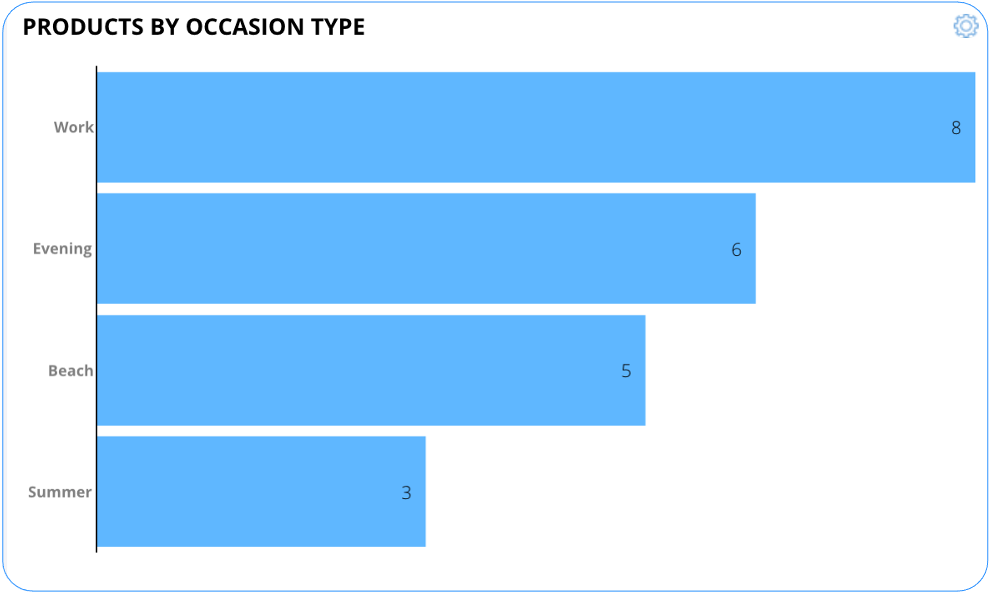
- Run and save a search on the Advanced Search page.
- Click on the Widgets button to open the New Widget dialog.
- Name - Enter a name for the widget
- Graph Type - Select Bars
- Sense of the graph - Select Horizontal
- Calculation - Select Number of results
- Breakdown By (X) - Select an attribute (only attributes from Single predefined value list or Multiple predefined value list are available)
- Click the Add to My Dashboard button. Your new widget is automatically added to the bottom of your dashboard.
Based on Date
To create a vertical bar chart widget based on a date attribute like this:
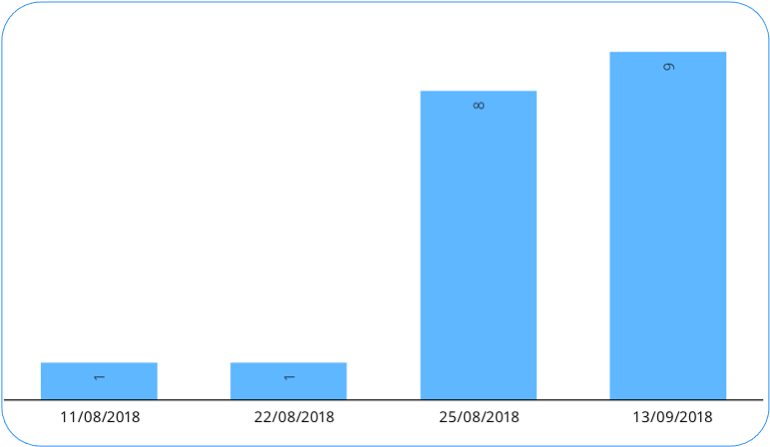
- Run and save a search on the Advanced Search page.
- Click on the Widgets button to open the New Widget dialog.
- Name - Enter a name for the widget
- Graph Type - Select Bars
- Sense of the graph - Select Vertical
- Calculation - Select Number of results
- Breakdown By (X) - Select the time interval on which the data should be displayed (day, week, month, year)
- Click the Add to My Dashboard button. Your new widget is automatically added to the bottom of your dashboard.
Updated 5 months ago
